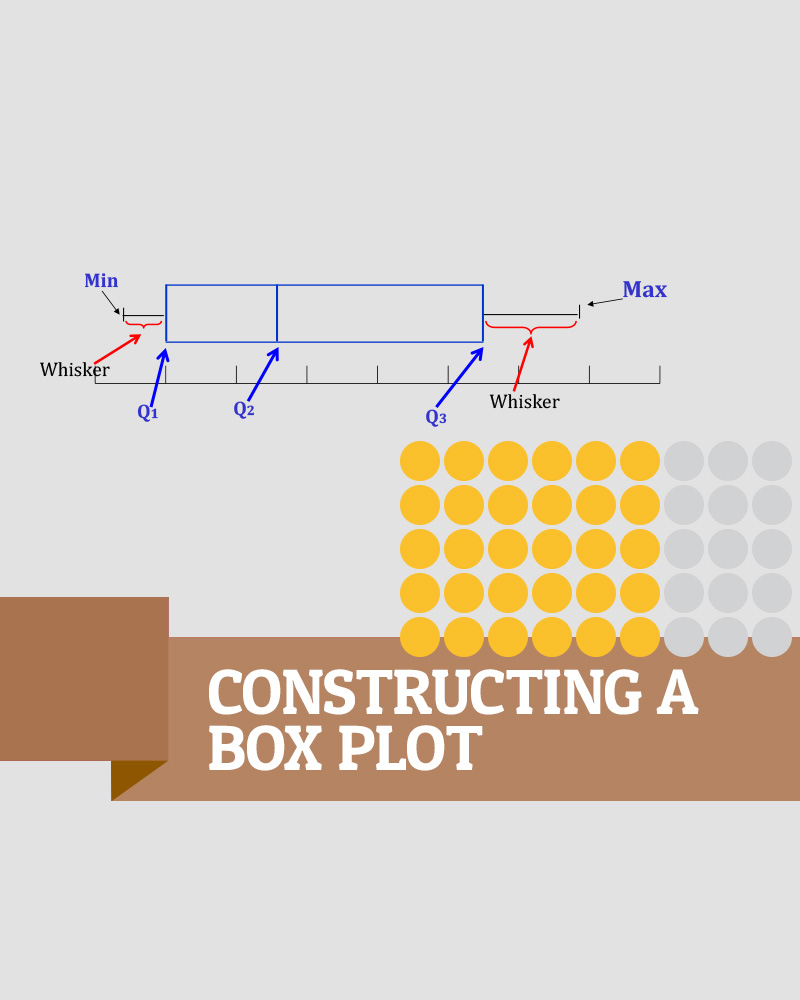
To draw a box-plot, we need five measurements, the minimum, Q1, Q2, Q3, and the maximum.
First of all, we need to rearrange the data set, find a position of Q1, Q2, and Q3 by the formula, and then find the actual value on each position. Those values are Q1, Q2, and Q3.